Code
Sample python code
print('Hello, Python!')Hello, Python!Python is one of the most widely used programming languages in business analytics and data science due to its simplicity, flexibility, and extensive ecosystem of libraries. In this book, we will use Python to implement various statistical techniques, data analysis methods, and visualization tools to support business decision-making.
###yes Key Advantages of Python in Business Analytics
Python and R are two of the most widely used programming languages in business analytics, data science, and statistical computing. Both languages have their strengths, but they cater to slightly different needs. Below is a comparison of Python vs. R in various aspects.
| Aspect | Python | R |
|---|---|---|
| Primary Use | General-purpose programming, data science, automation, web development | Statistical computing, data visualization, academic research |
| Best For | Machine Learning, Automation, Data Science | Statistical Analysis, Data Visualization, Research |
| Aspect | Python | R |
|---|---|---|
| Syntax | Simple, readable, similar to English | More complex syntax, designed for statisticians |
| Learning Curve | Easier for beginners, widely used in software development | Steeper learning curve, but powerful for statistical analysis |
| Aspect | Python | R |
|---|---|---|
| Data Manipulation | Pandas, NumPy | dplyr, data.table |
| Statistical Analysis | Statsmodels, SciPy | Base R, car, lme4 |
| Machine Learning | Scikit-learn, TensorFlow, PyTorch | caret, randomForest, xgboost |
| Data Visualization | Matplotlib, Seaborn, Plotly | ggplot2, lattice, plotly |
| Aspect | Python | R |
|---|---|---|
| Data Handling | Handles structured and unstructured data well | Primarily designed for structured data |
| Big Data Support | Integrates with Spark, Dask for large datasets | Not optimized for big data but integrates with Hadoop and Spark |
| Speed & Efficiency | Generally faster for ML and large datasets | Slower for big data but optimized for statistical tasks |
| Aspect | Python | R |
|---|---|---|
| Used In | Finance, AI, Web Development, Automation, ML | Academic Research, Healthcare, Pharma, Government |
| Common Applications | AI-driven analytics, automated reporting, cloud computing | Statistical modeling, survey analysis, experimental research |
| Aspect | Python | R |
|---|---|---|
| Community | Large, growing community in AI & ML | Strong academic and research community |
| Industry Adoption | Used by companies like Google, Netflix, Tesla | Preferred by universities, research institutions |
| Aspect | Python | R |
|---|---|---|
| Integration | Works well with APIs, web apps, databases | Strong integration with statistical packages |
| Flexibility | More versatile, can be used in different fields | Specialized for data analysis and statistics |
Download Python
Sample python code
print('Hello, Python!')Hello, Python!!pip3 install pandas
!pip3 install matplotlib
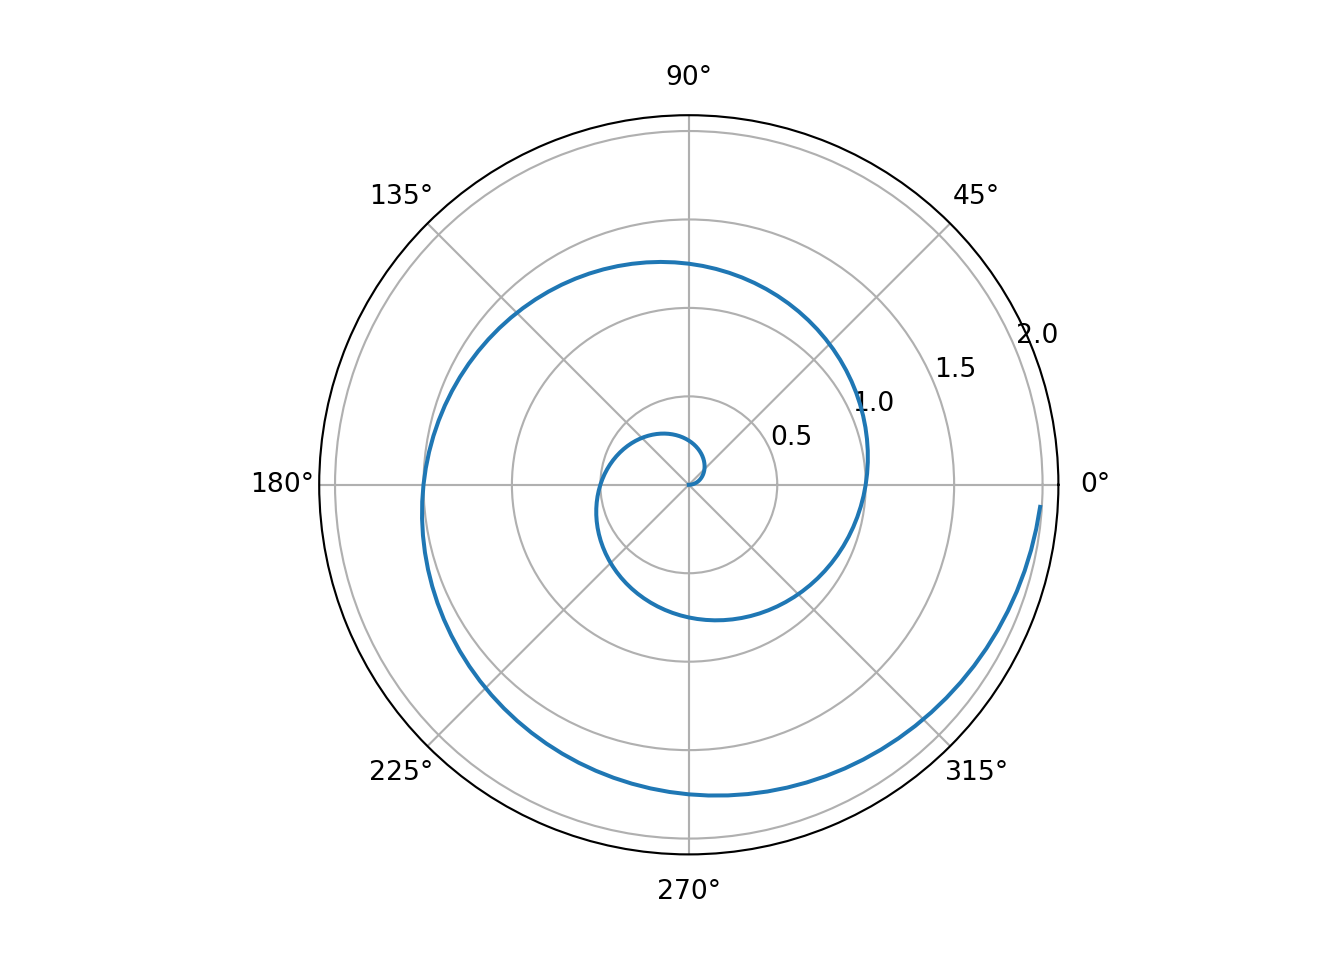
Sample plot using python
import numpy as np
import matplotlib.pyplot as plt

r = np.arange(0, 2, 0.01)
theta = 2 * np.pi * r
fig, ax = plt.subplots(
  subplot_kw = {'projection': 'polar'}
)
ax.plot(theta, r)
ax.set_rticks([0.5, 1, 1.5, 2])
ax.grid(True)
plt.show()